stardustsailor
Well-Known Member
Cannabis Sativa L ,needs light ..
A lot of quanta...
-----------------------------------------------------------------------------------------------------------------------------------
-------------------------------------------------------------------------------------------------------------------------------
And now the real "unknown world " ,regarding
Cannabis Sativa L .
The species' Circadian Rythms ....
Daily Light Integral and Pfr / Po....
Cannabis Sativa L . is way sensitive plant species ,
regarding duration of light and Far Red light Exposure ....
"Playing" with light regime and Far -red illumination ,
affects many aspects .
Really strongly.
In many of ways ,also.
===========================================================================
=================================================================================
===============================================================
====================================================================
--------------------------------------------------------------------------------------------------------------------------
As for the CS-RQE action Spectra ....
Read on ...
----
DETECTION OF CANNABIS PLANTS
BY HYPER-SPECTRAL REMOTE SENSING MEANS
ABSTRACT:
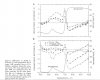
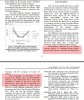
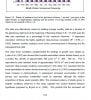
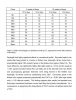
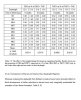
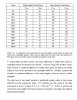
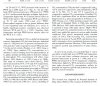
The dramatic increase of drug use, mostly hashish and marijuana, reinforces the demand for drug prevention and the need for accurate and updated information on cannabis fields. This study sought to evaluate the ability of Hyperspectral spectroscopy to discriminate cannabis from different scales and land use. The study was conducted in three stages: 1) Examination of the cannabis spectrum under laboratory controlled conditions from a short distance with field spectrometer and Hyperspectral camera under artificial light; 2) Remote sensing of the cannabis from an oblique view using static imaging spectrometer from 25m and 80m; and 3) Airborne Hyperspectral pushbroom sensor (AISA Eagle 400-1000 nm). This method of down/up scaling was found to be useful in understanding the meaning of spectral discrimination. Results of Principal Component Analysis (PCA) show that the spectral signal of cannabis (leaf and canopy) varied with distance from the sensor, however spectral bands with the most influence are in the range of 530-550, 670-680 nm and 705-720nm.
===============================================================
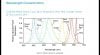
Development of Cannabis Spectral Signatures
And Cannabis Growth Simulation Model
=======================================================================
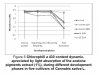
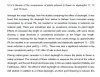
Spectral Discrimination of Cannabis sativa L.
...(...)...Leaves and Canopies
were in the 550 nm and 720 nm wavelength regions.
Spectral differences between marijuana and tree species
were larger than the differences between marijuana and
other herbaceous species. Again, the greatest differences
were near 550 nm and 720 nm. The “red edge” region
near 720 nm warrants further investigation. It may be
possible to exploit reflectances differences in the slope
of the red to near-infrared transition for species discrimination.
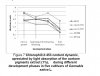
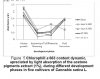
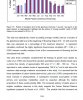
Canopy reflectance spectra of marijuana and several
representative species were simulated for a wide range
of LAI and background reflectances. Major differences
in canopy reflectance of marijuana and other plants were
observed near 550 nm, 720 nm, and 800 nm. Dense canopies
of marijuana were more spectrally discriminable
from other vegetation than sparse canopies. Thus, based
on measured leaf spectra and simulated canopy reflectance
spectra, we would choose several relatively narrow
(i.e., 30 nm or less) spectral bands in the green (550
nm), red (670 nm), “red edge” (720 nm), and the near-infrared (800 nm)
to discriminate marijuana leaves and
. canopies from other species.
=============================================================
 .....
.....
")
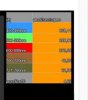
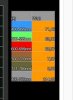
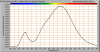
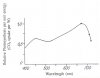
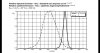
CS-RQE Cannabis Sativa dedicated action spectrum ,
points out easily, all of the above mentioned , pretty clear ....
Don't you think so ?
-Green ~547 nm ' droop '
-Red 674 nm "max rel. peak ' (!!! )
-Higher numbers of quanta absorbed & utilised ,
than those the other standards,
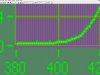
suggest ,between 700-720nm(FR )
Pretty easy ,to notice all those ...
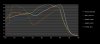
"Herb's" wl specific ' biases' and 'preferences' ......
Case closed ?

Cheers.

A lot of quanta...
-----------------------------------------------------------------------------------------------------------------------------------
-------------------------------------------------------------------------------------------------------------------------------
And now the real "unknown world " ,regarding
Cannabis Sativa L .
The species' Circadian Rythms ....
Daily Light Integral and Pfr / Po....
Cannabis Sativa L . is way sensitive plant species ,
regarding duration of light and Far Red light Exposure ....
"Playing" with light regime and Far -red illumination ,
affects many aspects .
Really strongly.
In many of ways ,also.
===========================================================================
=================================================================================
===============================================================
====================================================================
--------------------------------------------------------------------------------------------------------------------------
As for the CS-RQE action Spectra ....
Read on ...
----
DETECTION OF CANNABIS PLANTS
BY HYPER-SPECTRAL REMOTE SENSING MEANS
ABSTRACT:
The dramatic increase of drug use, mostly hashish and marijuana, reinforces the demand for drug prevention and the need for accurate and updated information on cannabis fields. This study sought to evaluate the ability of Hyperspectral spectroscopy to discriminate cannabis from different scales and land use. The study was conducted in three stages: 1) Examination of the cannabis spectrum under laboratory controlled conditions from a short distance with field spectrometer and Hyperspectral camera under artificial light; 2) Remote sensing of the cannabis from an oblique view using static imaging spectrometer from 25m and 80m; and 3) Airborne Hyperspectral pushbroom sensor (AISA Eagle 400-1000 nm). This method of down/up scaling was found to be useful in understanding the meaning of spectral discrimination. Results of Principal Component Analysis (PCA) show that the spectral signal of cannabis (leaf and canopy) varied with distance from the sensor, however spectral bands with the most influence are in the range of 530-550, 670-680 nm and 705-720nm.
===============================================================
Development of Cannabis Spectral Signatures
And Cannabis Growth Simulation Model
=======================================================================
Spectral Discrimination of Cannabis sativa L.
...(...)...Leaves and Canopies
were in the 550 nm and 720 nm wavelength regions.
Spectral differences between marijuana and tree species
were larger than the differences between marijuana and
other herbaceous species. Again, the greatest differences
were near 550 nm and 720 nm. The “red edge” region
near 720 nm warrants further investigation. It may be
possible to exploit reflectances differences in the slope
of the red to near-infrared transition for species discrimination.
Canopy reflectance spectra of marijuana and several
representative species were simulated for a wide range
of LAI and background reflectances. Major differences
in canopy reflectance of marijuana and other plants were
observed near 550 nm, 720 nm, and 800 nm. Dense canopies
of marijuana were more spectrally discriminable
from other vegetation than sparse canopies. Thus, based
on measured leaf spectra and simulated canopy reflectance
spectra, we would choose several relatively narrow
(i.e., 30 nm or less) spectral bands in the green (550
nm), red (670 nm), “red edge” (720 nm), and the near-infrared (800 nm)
to discriminate marijuana leaves and
. canopies from other species.
=============================================================
.....CS-RQE Cannabis Sativa dedicated action spectrum ,
points out easily, all of the above mentioned , pretty clear ....
Don't you think so ?
-Green ~547 nm ' droop '
-Red 674 nm "max rel. peak ' (!!! )
-Higher numbers of quanta absorbed & utilised ,
than those the other standards,
suggest ,between 700-720nm(FR )
Pretty easy ,to notice all those ...
"Herb's" wl specific ' biases' and 'preferences' ......
Case closed ?
Cheers.
Last edited:


 fire:
fire: