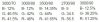
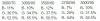
100 / (spectrum total / data point) = data point percentage.
You don't have data for 390 or 400, (the numbers on the right are the frequencies) but you can add the data points for the rest and use the total in the equation. The more points you digitize the more accurate the results will be, but a 10 point spread will probably give a decent rough estimate.
Spreadsheets make everything easier.
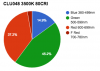
Here's what I got in the 400-500, 500-600, 600-700 ranges.
B- 9%
G- 34.5%
R- 56.5%
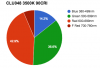
Also worth noting, using a 100nm spread for each color might not be entirely accurate since green is including 580-600, which one could argue is more valuable than "green"
View attachment 3780381
If we use slightly different ranges, 400-480, 480-580, 580-700 the picture changes a bit.
View attachment 3780382