a comprehensive review of economic anxiety in the rust belt
- Thread starter UncleBuck
- Start date

RickyBobby26
Well-Known Member
I'll bite: percentage of white residents. Right?
ETA: Doesn't that mean all the other counties were racist against Trump?
ETA: Doesn't that mean all the other counties were racist against Trump?
Last edited:
UncleBuck
Well-Known Member
finding some very interesting patterns in wisconsin that should vindicate @Padawanbater2 and his "economic anxiety" argument.
but that argument, i am seeing, overlooks one very important element.
rounding third base, will post soon.
but that argument, i am seeing, overlooks one very important element.
rounding third base, will post soon.
UncleBuck
Well-Known Member
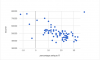
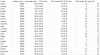
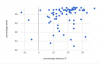
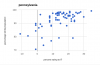
here a clear trend emerges. as income in a county go down, that county swings harder to the right.
that outlier in the lower left is milwaukee county, the only county in wisconsin with less than 80% white people (besides menominee county, which is 90% native american).
that is an important dot, and we will see why in a few seconds.
UncleBuck
Well-Known Member
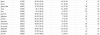
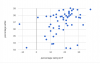
so what if we exclude milwaukee county, and just look at counties with some native american populations?
well, that's a more noticeable trend, but it is not quite fair. the counties with somewhat substantial native american populations are segregated. natives live on reservations, whites do not.
well, that's a more noticeable trend, but it is not quite fair. the counties with somewhat substantial native american populations are segregated. natives live on reservations, whites do not.
UncleBuck
Well-Known Member
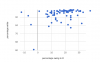
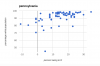
so let's exclude any county with 10-20% native american population and see what it looks like.
BINGO.
clear trend emerges. the more white a county is, the more they swung to the right.
so, what to make of all this?
am i right? or is @Padawanbater2 right?
the answer? we both are.
why?
it's not just that being white makes you buy into trump's racist-as-fuck message. rich white populations with no diversity did not fall for it at all, they even swung to hillary.
being poor and white was the key. when you are poor and white, trump's message of "blame the brown people" worked perfectly. if you can convince whites that they are poor because of brown people, the message works better the more poor you are, and the less diverse you are.
i'll probably go back and add a column for "percentage with college education" and it will spell this out even more clearly.
being poor, white, and dumb makes you an easy mark for trump.
UncleBuck
Well-Known Member
ozaukee county is 96.72% white. they swung to hillary by 12 points.
juneau county is 96.61% white. they swung 33 points to trump.
let's look at the difference between these two counties.
ozaukee county is just north of milwaukee. population of 87,000 and growing. median income of $75,000. 46.4% of people there have a college degree. 68% of the population is in the labor force, 5.5% are disabled, 5.3% don't have health insurance.
juneau county is in the middle of nowhere. population of 26,000 and shrinking. median income of $45,000. only 12% of these idiots have college degrees. only 59% of the population is in the labor force, 12% claim to be disabled brokedicks, and 10.2% of them have no health insurance.
looks like trump convinced the uneducated, brokedick, rural dwelling, uninsured, poor, desperate losers that everyone else was to blame. these people have no one to blame but themselves.
st0wandgrow
Well-Known Member
What you fail to mention (of course) is that Wisconsin had the lowest voter turnout for a presidential election in 20 years. Particularly in Milwaukee county, which is a Democrat stronghold. Young voters, and African Americans showed up in droves to support Obama, but stayed home for Clinton. Ironically, the state had it's highest voter turnout this year since 1972 for the primary election.ozaukee county is 96.72% white. they swung to hillary by 12 points.
juneau county is 96.61% white. they swung 33 points to trump.
let's look at the difference between these two counties.
ozaukee county is just north of milwaukee. population of 87,000 and growing. median income of $75,000. 46.4% of people there have a college degree. 68% of the population is in the labor force, 5.5% are disabled, 5.3% don't have health insurance.
juneau county is in the middle of nowhere. population of 26,000 and shrinking. median income of $45,000. only 12% of these idiots have college degrees. only 59% of the population is in the labor force, 12% claim to be disabled brokedicks, and 10.2% of them have no health insurance.
looks like trump convinced the uneducated, brokedick, rural dwelling, uninsured, poor, desperate losers that everyone else was to blame. these people have no one to blame but themselves.
Add it all up, and this wasn't about poor white folks turning to the dark side. This was about a piss poor candidate on the Dem ticket that failed to inspire her base.
http://host.madison.com/ct/news/local/govt-and-politics/election-matters/why-did-wisconsin-see-its-lowest-presidential-election-voter-turnout/article_6dd2887f-e1fc-5ed8-a454-284d37204669.html
UncleBuck
Well-Known Member
why would that be relevant to what i am trying to do here?What you fail to mention (of course) is that Wisconsin had the lowest voter turnout for a presidential election in 20 years.
i am looking for correlations between skin color and income with respect to the change in the electorate from 2012.
but if it makes you fell better, go ahead and bash on hillary a whole bunch while you go enjoy the trump family regime. super insightful.
UncleBuck
Well-Known Member
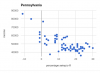
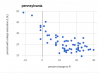
gonna compare chester county pa and forest county pa.
both have about the same number of white people in them. chester county swung towards hillary by 11 points, while forest county swung to trump by 23 points.
chester county is just outside of philadelphia. it has a bout half a million people living there, almost half of whom have college degrees. 69% of its residents are in the work force, only 5% are disabled, and they make about $86,000 a year on average.
forest county is way out in the sticks inthe middle of nowhere. only about 7,000 people live there, and of them only 9% have a college degree. only 23.8% of its residents are in the work force, and a whopping 20.4% of the residents there are brokedicks on a disability check. those who work make only $36,000 a year.
the funniest part? while females in forest county are only about a third of the population (versus 50% in chester county), they make up nearly 50% of the work force. the men are sitting around on disability while the women work in forest county. SAD!
the hillary counties seem like much nicer places to live than trump counties for sure.
UncleBuck
Well-Known Member
another nice comparison is lancaster county versus lackwanna county pa. both have about the same percentage of college educated residents, but lancaster county swung to clinton, while lackawanna county swung to trump by 24 points.
lancaster county is between harrisburg and philadelphia. about half a million people live there, 90% of them are white. about 67% of the residents work, only 7% are disabled, and those who work make about $57,000 a year.
lackawanna county is north of that, around the scranton area. about a quarter million people live there, and it is about 92% white. but only about 60% of the people there work, a good 10% of them are brokedicks on disability, and they make only about $46,000 a year.
again, the hillary counties are way more productive, honest areas than the trump counties.
st0wandgrow
Well-Known Member
Because in your OP you suggested that there was a "swing towards Trump" in certain counties. The link that I posted suggested that it wasn't so much a swing or shift in the way people voted, it was that the democrat base stayed home and didnt vote.why would that be relevant to what i am trying to do here?
We can disagree on why that happened, but it's pretty apparent to me that the reason they stayed home is because they didnt care for the person on the top of the ticket.
UncleBuck
Well-Known Member
clinton's vote total as of now: 64,654,445 (there are still millions of votes left to count)...the democrat base stayed home and didnt vote....they didnt care for the person on the top of the ticket.
obama's 2012 vote total: 65,446,032
the data is pretty clear on what happened. uneducated, poor, rural, white people voted in droves and it was just barely enough to tip the scales in a few states.