So you wanna be a trader huh?

WHODAT@THADOR

Well-Known Member
*NOTE This is going to take me several days to complete unless I just happen to get the time to power through it all.

Intro:
"Free and Fair market capitalism is the best path to prosperity"-Larry Kudlow....The good lord knows I hate Larry Kudlow.... But, he is correct in his statement....We are lucky to live in one of the few countries that allows you take control of your destiny and Capitalize on others Misfortunes...Sounds kind of sick right? Not if you knew that 70% of volumes traded across ALL exchanges belongs to the top 1%...Did you happen to know that every time there is a correction or recession the wealthy are lining there pockets with cash, while you the average working man with a simple 401k is left holding the basket? It's the greater fools theory who's gonna be the last one to buy the top and hold shares through the downturn.Now your no longer sick maybe a little pissed? The market is aware that the average American does not have time to follow his contributions,Doesn't watch CNBC, and damn sure does not understand Price to Earnings Ratios (P/E ratio) In this Article I'm going to cover basic trading strategies,Pattern recognition,Entry/Exit,Market Differences,Etc in hopes that it helps you grow your Savings, and give you a basic knowledge of Market Structure. The information I'm going to cover would cost thousands in classes or take a lot of time to research on your own. I hope this helps and Best of Luck in all your trades. BTW if you ever make 10 million dollars or something remember who showed ya how :wink::wink:
Enjoy
WHODAT


OOOOKKKKK....So your still around huh? Well let's go over some

Basic market information that you should be aware of.

There are several Types of markets and we are going to cover them here, But for the purpose of simplicity I am not going to go into correlations.

1. Forex: These are currency pairs, the highest volumes can be found in the USD/GBP, But there are also high volume pairs out there as well.The first is your Base currency 2nd is your qoute currency. Essentially it is telling you how much of the qoute currency you have to have to buy the base currency. Currencies trades in PIP's starting at 1/100th of the penny. These markets are not very volatile and move slowly for those reasons they are a good spot to start if you attempt to day trade.

2. Futures: Under futures you will find precious metals,stocks and commodities. These trades usually require a percent of margin per contract depending on your Broker. They also ROLLOVER meaning expire UNLESS you use a continuous contract....Ex. CL 08-14 is expired CL ##-## is the continuous and is similar to owning stock. Futures pay out a predetermined amount per dollar movement.

3.Stocks:Stocks trade on Indexes such as the Dow,S&P,Nasdaq,Russell,Nyse.... This is probably the one everybody is most familiar with Stocks do not expire unless your company goes bankrupt. Also, I am going to include ETF'S in this or Exchange Traded Funds which are comprised of percents of assets put together by whoever wants to. Bet you didn't know that?

4.Options:They trade on CBOE(Chicago Board Options Exchange) Options are probably the most under utilized Hedging tool you have in your arsenal at your exposure. All you ever hear is Hedge with gold....Well what happens if Gold starts falling? Did you ever think instead I should buy a deep out-of-the-money option to protect my investment because if my stock falls it will inflate and all I am out is the commisions?Hmmm......We may cover that later. But options trade in contracts of 100 shares with an attached premium and an Expiration date which will always be the 3rd Friday of every month(Except weeklies) So, this is what you would see CSCO 25.00C 7/16/14. There is also a shorter more confusing code. The way it is displayed changes with platform. I will include an options section below as I get to it.

5. Exchanges: These are the places your instruments will trade Amex,Nyx,Nymex,comex etc. This is important because you will pay these people monthly and not all data is created equal and will have varying rates.

Okay....So you are still reading...Well, thats good....

Basic Terminology and explanations of:

Instrument: Also called Security its essentially the fancy term for whatever your trading or the "Ticker Symbol" Ex. AAPL is the instrument or also known as Apple.

Margin: A percent on a instrument you borrow from the broker to purchase the said instrument

Margin Call: When your trade has gone so far against you that the broker requires you to deposit more money

Long: I own something that is backed with cash...or a little bit is margined and I believe the price of my security will rise.

Short: I am saying the security will fall in price. Also,these shares are borrowed from other people(Brokerages) to be re bought at a lower price. The act of rebuying is called COVERING. Some shares have a DAYS TO COVER note attached which is how long they will allow you to stay short.

Call Option: Is the right to own your security at the price of purchase(premium) at a fraction of the price. Its the same as being long we believe the price is going to rise.*BE AWARE options have a thing called THETA and they lose so much value each day.....anywhere from a penny to a dollar or slightly more.

Put option: Same as Call except we are saying the price is going to go down.

Technical Definition of call/put options: Is the right but not the Obligation to Buy or Sell said security on or before the expiration date.

ETF: Exchange Traded Funds are a compilation of stocks that can be created by anybody at a certain percent of each instruments assets essentially. They are either Leveraged, double-leveraged, or triple-leveraged against each included instruments assets and derivatives. JUST MY .2 CENTS they are also in theory going to be the next cause of "ECONOMICAL RECESSION" and there are too many article's to cite on that one. I do see it that way...JMO

Correction: Is a drop no Greater then 20% from the current High of either the traded security or the market.

Bull Market: Is a market making consecutive Higher High's and Higher Low's

Bear Market: Is a market making consecutive lower low's and Lower high's and is trading below 20% from the high's

Hedge: Is a loss prevention strategy.....Ex. I buy 100 shares of GILD @ 80.00 (cost 8,000.00 + commision) to protect my investment I buy Out of the money 70.00 Put option with the amount of time I plan to be in the trade. Let's say my Put option is trading .95 by 1.00 it just cost me 100 buck to protect my investment verses buying a bar of gold? You do the math??


Right so we now understand these terms? There are plenty more but that will do for now...LOL... Then onto some meat right???

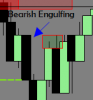
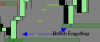
Candlestick Patterns

So,long story short Candlestick patterns were created buy this japanese guy named Homma around 18th century to keep track of rice and its prices....Simple enough??

This next section will cover REVERSAL patterns and END OF MOVE patterns only there are many many more patterns out there (Each as insignificant as the one before it...JMO) If you want to know them I suggest locating the Google button and typing in Candlestick patterns I promise you will not be let down.

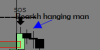
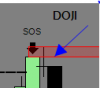
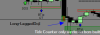
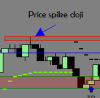
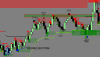
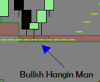
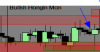
The Bullish hanging man: is a candlestick where the Bear's tried to drive through a support level only to have the session close above the open. It is almost by defintion a Price spike. It get's it's name because it looks like a stick figure with no arms.
Bull Hanging man.PNG Another Bullish hangin man.PNG
 
Last edited:

WHODAT@THADOR

Well-Known Member
Okay, so apparently you can only edit for so long didn't know that....

To finish up a bullish hanging man should be viewed as a possible reversal point to a Downtrend in the market.

Bearish Hanging Man: The opposite of a bullish hanging man. It is a to be viewed as a possible reversal point to a uptrend, and the possible beginning to a downtrend
Another bearish hanging man.PNGBearish Hanging Man.PNG

Bullish/Bearish Hammers:Similar in appearance to Hanging men, both are to viewed as end of move patterns. The only difference is in the placement
Bull Hammer.PNG Bear Hammer.PNG

Bullish/Bearish Engulfing Candlesticks: An Engulfing candlestick is one that consumes the prior candlestick, Usually the biggest come at end of moves and are slow to reclaim price. Don't believe me? Pull up a chart of Netflix NFLX and look at the one Icahn dumped and see how long it took to reclaim the price. They also are to be viewed as confirmation of the current trend taking place.
bearish engulfing.PNG Bullish Engulfing.PNG

Doji: Meaning same time same place in Japanese. Probably one of the most infamous Reversal Patterns as they truly depict moment's of indecision in the market There are several types of doji's.I have found through my back testing that the most reliable of them are the Crosses and inverse(upside down) crosses....For simplicity I refer to them as price spike Doji's. IMHO you should ALWAYS wait for the next candlestick when you see any doji as there are several ADVANCED PATTERN moves associated with them. I would highly suggest you do your own research on Doji's as there are more then I have featured here and as with all things in the market it's all about placement.

doji.PNG Longed-leg doji.PNG Price spike doji.PNG

Spinning tops: These usually occur right before moment's of volatility in what I like to call pinch's where there is very little price movement yet High volumes are being put in. They are unreliable at best. You can see below how you get three in a row contracting into smaller price movements yet the volumes in these sessions were very high then the bears break the floor and trap the bulls in.
Spinning Tops.PNG

Okay, so there are more candlestick patterns out there all you have to do do if you really want to kno them is GOOGLE it but as I said these are the main reversal patterns and are simple enough that you could get started and making money to fund yourself and continue to further your endeavors.

Trading Time Frames:

S
o, you need to decide when am I available to do this? Are my trades as a Long -term investor or do I wanna make money in the next hour? 3 BASIC CHART TYPES are Minute,Tick,and Volume. You need to be aware the more Data you require of a candle the slower it will be to respond to the pattern. A 60 minute chart will not show you a double bottom like a 1 minute
chart will. Whatever you chose its important you stay consistent in which frame you trade in consistency is important in creating consistent results right?

Minute charts: Are time dependent they tell you the open,high,Low and Close of what evertime frame you are trading.(1,5,10,15,30,60,120,240 min charts)

Ticks: Are independent of time they count individual trades per candlestick (33T 133T,233T,500T)

Volume charts: Are time independant and measure the individual shares being purchase.(33V,133V,233V,500V)

Unfortunately, most data providers and brokers don't provide Tick and Volume data. But there are several out there that do as independent providers its just gonna cost ya per exchange you want on it.

Ok.....Now we are going to look at easily identifiable end of trend moves that should be headed from the smallest frame chart all the way up to yearlies. These pattern's will help you in Determining When to enter trades, Identifying Support and Resistance points, and the current trend you are currently in. REMEMBER: Instruments spend 85% of there time in some form of consolidation and the other 15% trending.
 
Last edited:

mainliner

Well-Known Member
blah blah blah. , have you ever heard the saying ' some one has to be god'. Meaning ,some one has to be bill gates,, some one has to be mike tyson,, some one has to Donald trump,,, some one has to be the queen of England,,,do you really think these people made lots money from reading bullshit posts like this one , im surprised he didn't stop half way through and charge you 10 dollar each to read the rest ( yawn ...i wish he had of stopped half way through and died ,, boring!!) iv probley saved a million dollars in the time it took me to read it ....zzzzzzz...."making money is easy ,you buy a banana for a dollar you sell it for Two dollar,,easy"
any way if you know so much about making money, youd be wise to keep the secrets to your self , so as not to ruin it for the rest,, ask any buisness man how much profit he makes, hell tell you he runs at a loss,,only to protect how much hes really making,, ?GOD DAMN FACT,!!!
 

Fast50

Well-Known Member
Damn, i gota research hedging with options. Cool theory.. Like boxing stocks with multiple accts. But, is their any true edge.. Obviously there is based on risk/reward i guess.
 

Fast50

Well-Known Member
Look, your either a trader or not. Kinda like growers .. Most ppl never have the balls to start a $500 e trade acct. if they did and made simple,patient investments. They would have more financial freedom. Aint no secret.
 

mainliner

Well-Known Member
Okay, so apparently you can only edit for so long didn't know that....

To finish up a bullish hanging man should be viewed as a possible reversal point to a Downtrend in the market.

Bearish Hanging Man: The opposite of a bullish hanging man. It is a to be viewed as a possible reversal point to a uptrend, and the possible beginning to a downtrend
View attachment 3214235View attachment 3214238

Bullish/Bearish Hammers:Similar in appearance to Hanging men, both are to viewed as end of move patterns. The only difference is in the placement
View attachment 3214240 View attachment 3214253

Bullish/Bearish Engulfing Candlesticks: An Engulfing candlestick is one that consumes the prior candlestick, Usually the biggest come at end of moves and are slow to reclaim price. Don't believe me? Pull up a chart of Netflix NFLX and look at the one Icahn dumped and see how long it took to reclaim the price. They also are to be viewed as confirmation of the current trend taking place.
View attachment 3214254 View attachment 3214255

Doji: Meaning same time same place in Japanese. Probably one of the most infamous Reversal Patterns as they truly depict moment's of indecision in the market There are several types of doji's.I have found through my back testing that the most reliable of them are the Crosses and inverse(upside down) crosses....For simplicity I refer to them as price spike Doji's. IMHO you should ALWAYS wait for the next candlestick when you see any doji as there are several ADVANCED PATTERN moves associated with them. I would highly suggest you do your own research on Doji's as there are more then I have featured here and as with all things in the market it's all about placement.

View attachment 3214264 View attachment 3214265 View attachment 3214266

Spinning tops: These usually occur right before moment's of volatility in what I like to call pinch's where there is very little price movement yet High volumes are being put in. They are unreliable at best. You can see below how you get three in a row contracting into smaller price movements yet the volumes in these sessions were very high then the bears break the floor and trap the bulls in.
View attachment 3214430

Okay, so there are more candlestick patterns out there all you have to do do if you really want to kno them is GOOGLE it but as I said these are the main reversal patterns and are simple enough that you could get started and making money to fund yourself and continue to further your endeavors.

Trading Time Frames:

S
o, you need to decide when am I available to do this? Are my trades as a Long -term investor or do I wanna make money in the next hour? 3 BASIC CHART TYPES are Minute,Tick,and Volume. You need to be aware the more Data you require of a candle the slower it will be to respond to the pattern. A 60 minute chart will not show you a double bottom like a 1 minute
chart will. Whatever you chose its important you stay consistant in which frame you trade in consistency is important in creating consistent results right?

Minute charts: Are time dependent they tell you the open,high,Low and Close of what evertime frame you are trading.(1,5,10,15,30,60,120,240 min charts)

Ticks: Are independent of time they count individual trades per candlestick (33T 133T,233T,500T)

Volume charts: Are time independant and measure the individual shares being purchase.(33V,133V,233V,500V)

Unfortunately, most data providers and brokers don't provide Tick and Volume data. But there are several out there that do as independent providers its just gonna cost ya per exchange ou want it on.
btw nice paste'n'post
 

WHODAT@THADOR

Well-Known Member
btw nice paste'n'post
Thanx I think? Because that is my work...I wouldn't keep anything about trading secret because it has absolutely no bearing on how I make my money, But for simplicity you can believe there is quite a bit not in there. This is just to get people started.

Damn, i gota research hedging with options. Cool theory.. Like boxing stocks with multiple accts. But, is their any true edge.. Obviously there is based on risk/reward i guess.
Ya it's not theory though ...They are called synthetic option's Ex I buy 100 shares of AAPL @ 90.00 a share at the same time I buy the Out of the money Put option(1 contract) either the 80P or 75P and the premium(cost) on them would be dependant upon on how much time I want there. As,well if you were super bullish you could sell the 80P's against the position and significantly drop the cost of my shares.
 
Last edited:

WHODAT@THADOR

Well-Known Member
Sorry, had to open up a new page I hit my max for uploads.

Double-top: Can be easily identified by the "V" shape it usually makes. Essentially, it's the end of the Bull Rally to new Highs that occurs after a pullback then fail's to make new structure high's. Every once in awhile you will actually get a spike high where the session will be driven back and close below the prior high. Also you might get a run to the identical price. All of these count as double tops.

Double bottom: Is the mirror opposite of the double top and makes a triangle shape at the bottom. All of the same rules apply. The only difference is the Price action fails to make new lows.

The proper entry on this trade(Double-top) would be to have a resting order a penny beyond the swing low of the triangle...Stop loss place at high

Double Top &Bottom.PNG doubletop.PNG

The proper entry on this trade(Double-bottom) would be to have a resting order a penny beyond the swing high of the triangle...Stop loss placed at the low

Double bottom.PNG

Head-and shoulder: When this pattern fails its usually turns into a Bullish flag pattern and goes into consolidation then becomes a continuation of the prior Bull trend. You will usually see heavy selling on the left shoulder...These are "Early Bears" Getting some of the best pricing before they allow the Bulls to break to a new structure high.The bears will then sell down to around the prior low forming a neckline(usually comes in the form of a Moving Average)....This is your Head......The bull's then fail to make a new high on the right shoulder ....Entry should be made at the break of the neckline support with your stop at the high of the right shoulder.

cl double bottom..hd&shldr.jpg neckline.PNG

Inverse-Head & Shoulder(upside down): Take Everything I typed above reverse it and apply it here.

INverse headshoulder.PNG

These entries are all very conservative in nature and allow you to recognize points ahead of time that you can place your orders with stops and profit targets and walk away. Sounds good right? Well, now you need Indicators to go along with this new found knowledge that will help enhance when you take these signals and help filter out the false ones.

NOTE: I am also aware that I am missing a few things in my terms section that need to be added I will edit it once I figure out how.
 
Last edited:

bud nugbong

Well-Known Member
blah blah blah. , have you ever heard the saying ' some one has to be god'. Meaning ,some one has to be bill gates,, some one has to be mike tyson,, some one has to Donald trump,,, some one has to be the queen of England,,,do you really think these people made lots money from reading bullshit posts like this one ,
Bill gates was into computers, Tyson boxed, trump is into real estate, and the queen of England happened to come from the right loins. Nothing to do with investing or trading. well maybe trump, but no need to be a douche. whodat is a good enough person to try and help explain this stuff to the newbs, not trying to make anyone rich.


An unwise man once said.. "any way if you know so much about making money, youd be wise to keep the secrets to your self , so as not to ruin it for the rest,, ask any buisness man how much profit he makes, hell tell you he runs at a loss,,only to protect how much hes really making,, ?GOD DAMN FACT,!!!"

I don't think he's ruining it for anyone, and I don't think you know any business men. Not the crackdealer down the street trying to hide his income. But no business man is trying to hide how successful he is.
 

mainliner

Well-Known Member
Bill gates was into computers, Tyson boxed, trump is into real estate, and the queen of England happened to come from the right loins. Nothing to do with investing or trading. well maybe trump, but no need to be a douche. whodat is a good enough person to try and help explain this stuff to the newbs, not trying to make anyone rich.


An unwise man once said.. "any way if you know so much about making money, youd be wise to keep the secrets to your self , so as not to ruin it for the rest,, ask any buisness man how much profit he makes, hell tell you he runs at a loss,,only to protect how much hes really making,, ?GOD DAMN FACT,!!!"

I don't think he's ruining it for anyone, and I don't think you know any business men. Not the crackdealer down the street trying to hide his income. But no business man is trying to hide how successful he is.
your obviously not a buiness man then,,all my family are self made millionares, and they always go on about how easy it can be if you just put all the bullshit jargen. To the side and see buiness for what it really is,,,,money and profit,,,its allright educating people, but the educations abit over board,so any one reading this,------ buisness is easy, you buy an apple for 1dallar , you sell it for 2 dollar,,,easy,,, money and profit,,,
 

bud nugbong

Well-Known Member
keep your fruit selling tactics to yourself. Are you the great William fontane deutrive, coming from all this money? This thread isn't about business Its about trading.

your obviously not a buiness man then,,all my family are self made millionares, and they always go on about how easy it can be,,,
I know people like you. that's a sig worthy quote right there.
 

WHODAT@THADOR

Well-Known Member
your obviously not a buiness man then,,all my family are self made millionares, and they always go on about how easy it can be if you just put all the bullshit jargen. To the side and see buiness for what it really is,,,,money and profit,,,its allright educating people, but the educations abit over board,so any one reading this,------ buisness is easy, you buy an apple for 1dallar , you sell it for 2 dollar,,,easy,,, money and profit,,,
Yes, But now before I continue working on this I'm going to show Everybody how to make money on APPLE.... and turn $1.00 into $10.00

So, This is a ADVANCED option strategy that will require you to have a Margined acct. Essentially you are going to put on an almost Risk free trade AND make the market pay you to put it on. Remember when I say contract that 1 option contract=100 shares. Here you go:

This strategy is called an Iron Butterfly for our purpose's we are going to put this trade on every Thursday afternoon and exit around 11:00 every Friday the following day. This is to ONLY be done with WEEKLY options. You make your money off the Time Value Decaying and option lose a huge amount of value the night before they Expire.

So, APPL is trading at $90.00 we are going to be Sellers of the 90C(call) and 90P(Put) that expire tomorrow......They are both currently trading around 1.80 by1.88 let's say so it looks like this:

90C 1.80-1.88
90P 1.80-1.88

We are now going to purchase Out of the money Call/Put option Approximately 2-3 strike prices out
So for our purposes we will buy the 95C and the 85P they are currently trading at .13-.15 cents ..So I am actually paying 15 dollars a Contract. Our trade Now looks like this
95C .13-.15
90C 1.80-1.88
90P 1.80-1.88
85P 13.15

The market is going to give us a NET CREDIT(Cash up-front) for this trade To figure that out we have a formula:
(90C-95C)+(90P-85P) x 100= NET CREDIT

So it would really be:
(1.88-.15)+(1.88-15) x100=$346.00

That is how much the market is going to pay us to put this trade on pr contract you sell 10 contracts thats almost 3,500.00

Now you wake up tomorrow half the value is gone so when you close position you collect $123.00 on your $30.00 investment thats around a 400% return BTW.

Now that is how you make money on Apples
 

mainliner

Well-Known Member
keep your fruit selling tactics to yourself. Are you the great William fontane deutrive, coming from all this money? This thread isn't about business Its about trading.


I know people like you. that's a sig worthy quote right there.
so your saying this thread is not about biusness but trading, its all about money my friends,, cash is king, talk is cheap, what is the main reason your learning about trading,,,,,money,,,,how do you make money,,trading and buiness,, trading is biusness any thing you do to make money is buismess,,,in just saying if want to spend half your life learning about big long buisness or trading techniques,,you've just wasted half your life were you could be making money,,,money makes the world go round, not tradinging, people wouldn't do trading if they got payed small cash,,money money money,,,don't waste your time with bs knowledge ,,,you could go to uni for 6 years to learn buiness skills, or you could just open a fucking buisness,,simple,,cash is king , everything you learn from mister trading guy on this thread , never forget, put pen to paper and write your own cheques ,,good luck
 

WHODAT@THADOR

Well-Known Member
*I'm gonna try to slam the rest into this page to keep it from becoming to broken up...which means I only get 10 Pics....Sorry

Moving on you may find that you want to using moving averages, I only do on higher time frames 60 minutes up to weeklies.

There are other strategies that involve entry/exit when these averages cross they are simple enough and thats when you enter and exit.

Types:

Simple Moving Average(SMA): Look at it like these are true averages....They have no weighting and move with pure price action....Also they are a little slower to respond

Exponential Moving Average(EMA): Is weighted to time and responds quicker to new data being put in and filters out older data

Weighted Moving Average(WMA): Can also be averaged to Volume but is essentialy responds to the same weighting criteria of the EMA. To be quite honest I never liked how they read Price Action so therefore I never use em and my knowledge is limited on how they are exactly weighted to new data...JMO

Now, the most important aspect of these averages are the periods of time yo are measuring. IMO a properly set-up Daily chart should have a 5 and 20 EMA...Along with a 50 and 200 day SMA ...Like, this one:

NOTE: Every time the 5&20 EMA cross(orange/purple) You would enter your trade based on the Moving Average strategy.

movingaverages.PNG

Relative Strength Index(RSI): Is a indicator running between 0 and 100 with any reading below 20 being Oversold and any reading above 80 being Overbought. 50 is used to determine the current strength of the instrument...Any reading above is considered to be in a Bullish state in reading below is considered to be in a Bearish state. For DAYTRADING this is the only indicator I use along with the Parabolic SAR(Stop and Reverse) You base your trade off of the Divergence, there are two states Bullish/Bearish .... EX. When a instrument becomes oversold, we will say its at 6 then it recovers goes to 18 then dives back to 10 that is bullish divergence ...It made a higher low....The opposite is how you get Bearish Divergence.

Here's an example of a trade put together using the RSI along with Visual candlestick Patterns:
RSI.PNG

Buy using the divergence as a requirement before we take the trade, it filters us out of quite a few false bottoms.

Parabolic SAR(Stop and Reverse): It does exactly what it sounds like its a formula derived from the prior days closes and determines AF(Acceleration Force) or momentum of the move. So, for our purposes we will use it as a Filter to keep us out of trades we will only look to enter a trade when it stalls out and goes flat and our Parabolic is taken out(Closed below Parabola)(Parabola is the dot...LOL). To know if the parabolic has truly been taken out you have to wait till the close of the candlestick you are watching.

shabang.PNG

Back testing: You ever here someone say well we have years of back testing to support our data or we have been back testing for years? That just means they sat down with a piece of paper or computer program and ran there formula across years of data to see how it would have performed. I recommend you do that don't just take me at my word run it and see how it would have performed for you if that was the only trade you took? Remember from the beginning we talked about consistency. You have to have consistency to deliver consistent results.

Conclusion:

Sure, there is quite a bit I have left out; but it falls into the realm of "Advanced". I have no problem answering any question's if your interested and promise I will not "Charge you $10.00 buy now... -MAINLINER" They say if you enjoy what you do then you have never worked a day in your life, if that's the case I have not worked in awhile. I have no problem taking from the 1% as I view it as owed money. But if you are not going to do anything about it today to change your tomorrow then stop Bitching about it. I view everything as it should be the 1% control it all the price of Gold,Corporate taxes, Minimum wage, politicians, and the laws. I do not believe Corporations will be the end of the world either, But I do think it's very sad and disgusting; but it is what it is...neither you nor I can change these thing's...But what we can do is make our tomorrow a better place with things like integrity and honesty, True compassion for those in need and never forgetting where we come from. The very first SCAM that tought me to trade was full of nothing but the elderly who didn't have a clue what was really going on. These people where putting in thousands a "DVD" that promised wealth but was incomplete as I could see it and despite numerous complaint's the SEC has done nothing against them. Take this bit of new knowledge and add to it if you didn't know it already, and realize that everything I said is applicable across all time frames no matter when your available to trade, manage your future do not pay somebody else too who say's "your lucky to get 10% a year on your money"
You can make 1000's of percents....How hard are you willing to work?
WHODAT

"PEOPLE SAY THEY CAN, AND PEOPLE SAY THEY CAN'T, EITHER WAY THEY ARE ALWAYS RIGHT"
-Henry Ford
 
Last edited:

st0wandgrow

Well-Known Member
The advent of publicly traded companies will be the downfall of civilization. Prior to individuals being able to buy stock in a company, a business owner could grow his business as much, or as little as he/she desired. There were no external forces aside from customers. Now, companies have to continue to expand to appease their share holders. There is no such thing as good enough. Corners are cut, and people are fucked over all in the name of growth and profit.

I pulled my money from the stock market years ago. It disgusts me honestly.
 

WHODAT@THADOR

Well-Known Member
The market is weird. Every time one guy sells, another one buys, and they both think they're smart
Usually its because there both right, depends on your time frame

The advent of publicly traded companies will be the downfall of civilization. Prior to individuals being able to buy stock in a company, a business owner could grow his business as much, or as little as he/she desired. There were no external forces aside from customers. Now, companies have to continue to expand to appease their share holders. There is no such thing as good enough. Corners are cut, and people are fucked over all in the name of growth and profit.

I pulled my money from the stock market years ago. It disgusts me honestly.
Well, publicly traded companies have been around for over a century and we are still here? There's several cycle's and they are all predictable..... A company cannot be forced to go public "Hostile takeover's" only occur with public companies. A company has the right to remain in the private sector as long as they wish...which means they have the right to grow there company at whatever rate they chose...Even "S class" corporation's do not HAVE to have shares available. That is usually up to the owner originally. I do agree that the market disgust me, but I would not pull my money from it...Maybe you have a different Retirement plan?
 

mainliner

Well-Known Member
apples 2 for 1 while stocks last , don't delay , buy today,,,,,??? How much stock have they got though, hmm never thought of that, what an ad scam!!
 

WHODAT@THADOR

Well-Known Member
apples 2 for 1 while stocks last , don't delay , buy today,,,,,??? How much stock have they got though, hmm never thought of that, what an ad scam!!
Do you know what kind of F%%king idiot you sound like? Where's there a ad? Man, you have single handedly got to be the dumbest person I have ever had the displeasure of bumping into in my life...Do you not realize that plenty of people around you actually wanted to hear some of that? I got there memo's and stuff... Yet again where is there a ad? I actually spent some of my time contributing what have you done? How have you ever run one business being the Lazy A$$ you are? Buy the way its 5.98B shares that's what they have you Idiot... You are a no good joke .. Tell your mom I said hi she will remember me:finger:
 
Top