CRI test and Mcree weighted results

NoFucks2Give

Well-Known Member
Dont troll threads that have nothing to do with what ever it is that is bothering you.
@ttystikk @CobKits

I guess I do not understand the etiquette of this forum. When or when not to respond. For example I just got a notification for this post:
at least be on the same page as everyone else here, we are growing cannabis:
Here we have an obvious nonsensical unscientific graph being used to discredit me on a resolved topic with something irrelevant to the topic referenced.

Do I explain there is no data in the "Spectral Discrimination of Cannabis sativa Leaves and Canopies" study that correlates with McCree?

Do I explain that a graph with no author, no source, no explanation, and no equations is meaningless?

Would you rather I ignore such unscientific rants and allow this site to go the way of the flat earth forums?
I am not a big fan of the pseudo science rampant on this site but this graph is more like fake news.

Should I show this person what a McCree graph would look like if it used the actual numbers from the McCree Study?

This graph uses the mean numbers from McCree pages 208 and 210 highlighted in yellow in the attached copies of these pages for the Absorptance and Action tables and the.
Absorptance+Action is the same McCree numbers multiplied together. Action x Absorptance

absorptionAndActionMcCree.jpg

Now fake Quantum Efficiency from numbers fudged with McCres's Quantum Yield of photosynthesis does not correlate with Daughtry and Walthall becasue in their "Spectral Discrimination of Cannabis sativa Leaves and Canopies" paper (attached), the words quantum nor efficiency nor action are in the document. Absorptance was used once but no absorptance figures were reported. Chlorophyll was also mention but just to say that it is green.

This site is similar to a flat earth group on Facebook.

We went to school and learned the earth is round. Science had reached a consensus that the earth is round.

Schools teach that photosynthesis efficiency is reduced in the 500nm to 600nm wavelengths.
Science had reached a consensus that photosynthesis efficiency is reduced in the 500nm to 600nm wavelengths.
Yet some say this is not true. Some even say that 500nm to 600nm wavelengths are critical and better than blue or red.

And the opposition response to to this mimics the flat earthers saying the earth is flat and trying to prove it is flat with irrelevant information.

Anecdotal comments and opinion are not scientific evidence.

Scientific evidence typically results from an experiment with consistent reproducible results.
If you have data or have something to say regarding your experience you should include how the data was generated or why we should believe what you have to say that is not agreed upon by Science.

It would be advantageous for someone to understand what they are posting before they post it as evidence.

Posting a fake image without any explanation as to what it proves or why is supports you position just makes you look foolish.

Then along comes @nfhiggs to back up the fake science.
 

Attachments

nfhiggs

Well-Known Member
@ttystikk @CobKits

I guess I do not understand the etiquette of this forum. When or when not to respond. For example I just got a notification for this post:


Here we have an obvious nonsensical unscientific graph being used to discredit me on a resolved topic with something irrelevant to the topic referenced.


Posting a fake image without any explanation as to what it proves or why is supports you position just makes you look foolish.

Then along comes @nfhiggs to back up the fake science.
Is that anything like the fake news that Trump keeps complaining about?
 

NoFucks2Give

Well-Known Member
Is that anything like the fake news that Trump keeps complaining about?
No. It's about you patting someone on the back not because it is true because it's what you want to believe. You obviously do not care if it is true. Trump? That's the best you can come up with? When it comes to Science, Trump is not who I think of.
 

nfhiggs

Well-Known Member
No. It's about you patting someone on the back not because it is true because it's what you want to believe. You obviously do not care if it is true. Trump? That's the best you can come up with? When it comes to Science, Trump is not who I think of.
I see humor is just wasted on you.
 

NoFucks2Give

Well-Known Member
I see humor is just wasted on you.
This is funnier than the Trump line. I got little chuckle out of it. It's possibly the association with some one implying I am not competent and you patting him on the back may have taken the humor out. Or it could be that it just was not funny.
 

NoFucks2Give

Well-Known Member
Can we agree that there are two groups, one that believe green is useful and necessary and one that believes that it is not?
How about we agree there are more colors between 500 and 640nm than green. I like red, white, and blue. My thinking on the white, it is a catch all. If there is a magic potion in the 500-640nm then white has it covered. I also look at the economics, the number of photons for the buck.
I do not think green is the magic potion. Yellow is a contender.

This thread was on the right track. This is a significant topic.

I measured Quantum PAR for two CoBs. CLU028-1204C4-303M2K1, 3000K 80 CRI and CLU028-1204C4-273H7K4, 2700K 97CRI
The measurements were made with a StellarNet BlueWave Spectometer with the NIST LED profile calibration traceable to NIST standards.
The measurements were taken on May 20th 2017, and I do not remember the distance between the detector and the CoB.

3000K 80 CRI 484/477 µmol/m²/s
2700K 97CRI 430/414 µmol/m²/s

Where the slash is total PAR / PAR between 400 and 700. The far red is removed in the smaller number.

Plants do not care about the wavelength of the photon. Let's agree to disagree there. That is what my textbook says. There is a thing about blue having more energy per photon than green and red, but the plant blows if off as heat and the resulting bio-chemical action is the same for protons of any wavelength.

But no need to get stuck arguing over it. Let's just move on and you can make your choice of 70CRI vs 97 CRI in the privacy of your own home.

Each CoB was measured at the same distance from the detector and driven with the exact same Mean Well HDD-H driver with a fix current.
The CoBs were mounted on a 1.5" wide, 0.125" thick, 24" long bar of copper suspended on a Gorilla Grow Tent.
The graphs were created with a custom PHP app that reads the values from a data file created by StellarNet's SpectraWiz Spectroscopy Software and converted to an SVG image.

blueWaveCoB.jpg

These images use quantum µMole measurement, not radiometric watts as in the datasheet's SPD.

3000K 80 CRI

CLU028-1204C4-303M2K1_483PAR.jpg

________________________________________________________________________________


2700K 97CRI

CLU028-1204C4-273H7K4_429PAR.jpg

________________________________________________________________________________


Here is the difference and at the heart of this topic. The photon difference between the 3000K and 2700K came from an increase in the blue green yellow, and decrease in red.

If you want to weigh that with McCree, that is simple math, so I will multiply the value in the top two images by the mean values from pages 208 and 210 absorptanceTableMcCree.jpg actionTableMcCree.jpg
and redo this same set of images and PAR values.


3000K 80 CRI minus 2700K 97CRI

I hope this at least puts an end to the CRI red debate. Red is the dominate color in CRI. Texas Instruments has an LED driver especially for CRI adjustments. It has an heavy duty efficient switching buck step down LED driver for white LEDs and a linear current regulator for a string of red.

3000K80-2700K97.jpg

________________________________________________________________________________

Superimposed.

CLU28-1204C4-2700k97cri3000cri80.jpg
________________________________________________________________________________

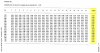
These are the values from pages 208 and 210 highlighted in yellow.


absorptionAndActionMcCree.jpg
 
Last edited:

NoFucks2Give

Well-Known Member
Citi CLU028-1204C4-273H7K4 (used in previous post.)
Vero Decor BXRC-17E4000-F-24 1750K 97CRI
Luxeon Fresh Focus Red Meat L2C5-RM001211E1900 2200K CRI not specified but nearly identical to Vero CRI 97

I put some bright white photographic paper on the bottom of the tent.

colors.jpg

_______________________________________________________________

The Citi is the 2700K

CLU28-1204C4-2700k97cri3000cri80_redMeat2000K.jpg


_______________________________________________________________


Red Meat 2200K MINUS Citi 2700K 97 CRI

RedMeat445PAR-CLU028-1204C4-273H7K4PAR429.jpg

_______________________________________________________________

Citi 2700K 97 CRI MINUS Vero 1750K BXRC-17E4000-F-24

CLU028-1204C4-273H7K4-BXRC-17E4000-F-24.jpg

_______________________________________________________________

Red Meat 2200K MINUS Vero 1750K BXRC-17E4000-F-24

L2C5-RM001211E1900-BXRC-17E4000-F-24.jpg
 

NoFucks2Give

Well-Known Member
Well the numbers are in. The results were underwhelming.

I only used the Action figures from page 208 of the McCree study. I did not use Absorptance.

Where the CLU028-1204C4-303M2K1 was 477 µmol/m²/s by multiplying the quantum value at each wavelength by the Action percentage
The PAR for the 3000K CRI 80 went from 477 to 368.
The PAR for the 2700K CRI 90 went from 414to 333. 86% to 90%

The 2700K 90 CRI improved 4% relative to the 3000K (FROM: 447/414 = 86%, TO: 368/333 = 90%)

Red Meat went from 424 to 357 Compared to the 3000K 80 CRI the change went (FROM: 447/424 = 88%, TO: 368/357 = 97%)

________________________________________________________________________


3000K80CRI x Action Was 477, 477µmol/m²/s x Action = 368µmol/m²/s

3000K80CRIxAction.jpg

_______________________________________________________________________


2700K97CRI x Action Was 414, 414µmol/m²/s x Action = 333µmol/m²/s

2700K97CRIxAction.jpg

_______________________________________________________________________


Red Meat 2200K x Action was 424µmol/m²/s times action = 357µmol/m²/s


redMeatTimesAction.jpg

I converted the the Action values from page 208 of the McCree study with the in between extrapolated values I used in the calculations to a tab delimited txt file attached to this post as action.txt
This txt file can be imported or pasted into excel or open office spreadsheet.

Format: wavelength TAB value LINE_FEED

Page 208 Action Figures=>View attachment 3969809
 

Attachments

Last edited:

NoFucks2Give

Well-Known Member
Preliminary PAR test results
3000K70CRI 950
3500K80CRI 921
3000K80CRI 905
3000K90CRI 856
2700K90CRI 780
Your 3000K80CRI 905 and 2700K90CRI 780 (780/905 = 0.86187845303867403314917127071823)

Match my measurements exactly (proportionately)

3000K80CRI 477 and 2700K97CRI 414 (414/477=0.86187845303867403314917127071823)

You must have used Citi also. And an instrument traceable to NIST standards.

For the sake of data integrity and reproduciblity, I have uploaded the data files from the StelarNet software for both of these files.
If you add all the value the PAR will be 483.92 and 429.67
Between 400 and 700 the sum will be 477 and 414
 

Attachments

NoFucks2Give

Well-Known Member
think about that
I assume you are inferring it is unscientific to not remember the distance.
My comment "I do not remember the distance between the detector and the CoB" is superfluous to that task at hand.

The data recorded from the measurement in µmol/m²/s at each wavelength from 400nm to 769nm.
The total PAR value is the sum of these data points up to 700nm.
In the program that generates the graph I store the sum or all the data points and the total PAR like this

$spectra = explode("\n",file_get_contents('3000K80CRI.txt')); //CLU028-1204C4-303M2K1 483.92067 PAR 477
$spectra= explode("\n",file_get_contents('2700K97CRI.txt')); //CLU028-1204C4-273H7K4 429.6703 PAR 414

The data on the graphs are normalized. This means the values will be scaled. The values remain relative to one another but are no longer absolute. Inverse square is not required and therefore distance is not required.

I convert the $spectra from text to decimal $values.

$max = max($values);
$scale = 280/$max;
$normalize = 1/$max;

for each wavelength I get the x and y values to be plotted

$y = round(300 - ($scale * $values[$wavelength] ));}
$x = ($wavelength - 380) * 2;

Then add the vertical line for that wavelength to the SVG image.

echo '<line x1="' . $x . '" y1="300" x2="' . $x . '" y2="' . $y . '" stroke="#' . $hex[$wavelength] . '" opacity="1"/>' . "\n";

Where stroke is the color of the line and $hex is the HTML hex color value.

No DISTANCE is required.


RE: the graph, I have nothing further to say, my original comments stand: obvious nonsensical unscientific i.e. fake graph.
 
Last edited:

sethimus

Well-Known Member
RE: the graph, I have nothing further to say, my original comments stand: obvious nonsensical unscientific i.e. fake graph.
it's mccree's rqe curve - the c4 plants action spectra and adjusted to the cannabis absorptance curve of Daughtry and Walthall.
more relevant to the task than the action spectra you presented so far...
 
Top