PAR test of COBs vs Samsung 561 boards

CobKits

Well-Known Member
I was looking for a better way to quantify the output and efficiency of COBs vs the newer PCBs (in absence of a 2m sphere, and in absence of any real low-current COB sphere data out there). The sphere i usually use to do COB testing is 20" and i usually put the COBs just outside shining into its 2" port. The large size PCBs didnt really work here, as putting it inside the sphere created a lot of surface area for absorbance, skewing the results. My first attempt at quantifying output was to use the same aluminum substrate the PCB is on, and mount a single COB to the back of it.

upload_2017-6-10_23-15-18.png

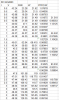
The idea was that i could test a PCB or a COB and have the same hardware inside the sphere. I mounted an ideal holder so i could test various 28mm cobs. Thats an HLG first gen QB, and i tested a citi 1212 gen5 and a Luminus CXM22. So i tested the QB and the single COBs at various currents and plotted PPFD/W vs Watts.

upload_2017-6-10_23-21-9.png

of course the QBs smoked a single (small) COB but the idea was to determine what number of COBs equaled a QB. This was simulated by multiplying the single COB's PPFD/W output by arbitrary numbers to see what wattage (i.e number of COBs) would match the QB efficiency at a given wattage. As you can see, 3 CXM22s or 5 citi1212s did a pretty good job of approximating the QB

A reasonably fair test but biased for a number of reasons, not including the fact that the sphere stuffed with the awkwardly large (relative to sphere diameter) board might skew data, with the board throwing light in all directions and the COB being a (relatively) point source of light. Also the fact that the thin QB board wasnt really a ideal heatsink for the COB chips in terms of removing heat from the chip efficiently

On top of that both that model QB and that model COB used in that test are not current top-bin offerings.

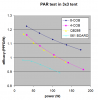
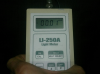
I felt that i wanted to test a REAL multiple number of cobs in a real environment. So i rounded up a couple different models of current PCB offerings, and some of the latest cobs and erected a fresh 3x3 gorilla tent for dedicated testing. I made 5 marks on the bottom of the tent to take measurements at 5 different places to get good averages. i made care to make sure that the Li-Cor LI190 sensor was set in the same location and same relative orientation each time (leveling bubble toward me at 6 o'clock, cable at 2 o-clock)

upload_2017-6-10_23-33-11.png

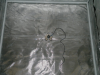
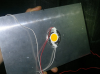
The tent was light-proof when zipped up, so while the square geometry is not the ideal photometric measurement, i felt with the reflective walls and averaging multiple measurements, i would be able to get a good estimation of total PAR available and how it scaled with current. This 'total collection of light' approach was important due to the different sizes of COBs vs PCBs, i didnt want to take just a spot measurement at a distance due to the different way they throw light. Here's a pic of LI-COR with tent zipped up

upload_2017-6-10_23-37-44.png

all of the test boards were mounted at the same height, hung in free air approximately 12" down from the top to allow for some natural convection.

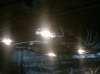
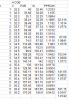
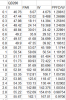
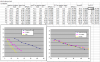
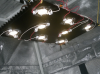
I mounted 8 ideal holders for COBs on an HLG slate 2 heatsink. Not ideal as its a relatively thin heatsink but decent for a simple test since were keeping the cobs well under 50W each. The COBs i'll be using in this intial test are Citizen 1212 gen6 3000k 80cri due to their relatively low cost. By connecting and disconnecting COBs I was able to do an 8-up and a 4-up test.
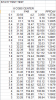
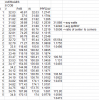
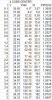
8-up test:

upload_2017-6-10_23-41-11.png
 
Last edited:

CobKits

Well-Known Member
Don't keep us in suspense! Did the tent test show the same results as the sphere test or not? :cool:

Great work BTW.
patience grasshopper! there are results! takes time to type and i think its worthy of the detailed explanation so the vultures dont pick me apart lol.

Do a video so we can pick apart all the shit you are doing wrong like different lights on,dif types of tools laying nearby,wearing different shirts:lol:
We should chip in and get coberto a white lab coat
 
Last edited:

CobKits

Well-Known Member
ok so how do we go about testing these? lets start with the 8-up

for the record all of these tests are driven by my Korad benchtop power supply which i love to death

https://www.amazon.com/KA6005D-Precision-Variable-Adjustable-Regulated/dp/B00G0HAY3U

it weighs about 5x as much as the $50 PSUs on ebay which blow up. cant say enough good things about it.

OK so this cob array is ~36V (on the lower side since were running so soft). In both the 8-up and 4-up case all these cobs are in parallel so we can expect that the 4-up will show higher voltage for a given current

so were gonna do a long test in the center point, we'll test 0.1-1.0A in 0.1A increments, and then 1.0-3.0A in 0.2A increments, and then do 4 and 5A measurements. remember 5A ain't nothing when spread out in parallel.

and then for the 4 corners we'll test 1,2,3,4 and 5A and average them. we can plot out two complete sets of data from this. center-only measurement with lots of datapoints at different currents, and then the average of all 5 measurements (center+4 corners) at 1,2,3,4 and 5A. in the latter case we have less current points, but each current datapoint is made up of an average of 5 datapoints so hopefully it gives us some nice smooth curves.

lots of data to gather so let's go!
 

mefunky

Well-Known Member
Front row seating. Definitely interested in the results, I've been curious about those boards. Awesome work man.
 

CobKits

Well-Known Member
I've done this literally hundreds of times so ive gotten pretty good at bumping from 0.1A,0.2.....0.9,1.0, 1.2........3.0A and writing down the PAR measurements on my log sheet for later translation into excel. accuracy is sometimes limited by my handwriting lol, tho if i see an errant datapoint in the graphs i can find the typo pretty easily. If things look really off i just rerun it. i can generally get thru the whole test in 2 mins or so, and get a good accurate curve with some droop, but consistent from chip to chip so good data.

in this case the two animals we are comparing (discrete cobs vs large area boards) are going to have completely different thermal characteristics, so what were going to do is run thru each test quickly, and then pick an arbitrary wattage to let each setup run for about 10 minutes to get to a "steady state" and see what our max droop would be. in most cases this is 1-2% max relative efficiency and consistent from chip to chip so we can call the data valid at least.
 

CobKits

Well-Known Member
8-up COB measurement.

We have our fixed current increments so a measurement consists of two things to write down at each current.... we note the voltage on the power supply and the reading from the PAR meter. I was proud of the meter it did a great job, look at the precision of some of those readings. In the tent all closed up they were rock steady as well (esp at low currents with little to no droop). A good benchtop power supply is clutch for stuff like this because if youre using a Watts Up on the AC side of a driver for example you are introducing a variable in driver efficiency. so here we have a direct DC measurement. You can spend literally thousands of dollars on power supplies and picoammeters accurate to 6 or more decimal places, and often that's what the photometric labs use for the big spheres. If you want to get sticker shock go search "Keithley picoammeter" on ebay but i digress....

ok so we have our current, voltage and par readings for this test. units of PAR are PPFD of course, may not be so clear for some people. so column 1, I= current. column 2, V= voltage. Column 3, PAR = direct PPFD measurement recorded from meter

the last two columns are Watts (simply calculated by Volts x Current). and then PPFD/W (are PAR reading divided by Watts).

PPFD/W is a "universal" measure you can use to compare chips. As opposed to looking at a cree vs a vero vs a citi at say 1400 mA. They all have different voltages and are thus all operating at different wattages so you cant be apples to apples with just current.

You will note that PPFD/W numbers are much much much lower than my usual tests. that's because this is measuring a 0-200W light at the top of a tent, sensor on the floor, which is nowhere near as bright as the old open space measurements i used to do 12" from a COB (which were ~10 PPFD/W), or in the sphere where we are collecting ALL light from the COB and were at 30+ PPFD/W. So no matter, as long as we are reproducible from sample to sample in this particular test, and we have no tolerance for stray light! i went as far to do this right after sundown and was taking measurements with my headlamp on, so there is no light getting in there that wasn't produced by the fixtures

upload_2017-6-11_3-30-14.png
 

CobKits

Well-Known Member
That last measurement of 3A is steady state soak of 10 mins or so after test was completed. you can see that at steady state the 3.0A measurement dips in voltage and PAR
1.1656 PPFD/W @ 99.84W vs 1.17.51 PPFD/W at 100.8W

sounds reasonable. obviously temp is a factor and we try to minimize it. if that was more than the ~1% we are seeing i would redesign the test. sometimes droop can be a problem when testing single COBs north of 200W
 

CobKits

Well-Known Member
so heres our complete set of measurements for the 8-up cob test. first measurement for each current is center test. the next 4 are the corners (which may have gotten mixed up from test to test but were averaging them so no biggie what order its in)

we calculate PPFD/W for each measurement
5th column has 3 calculations for each current
-Average watts of all 5 measurements (will be our x axis datapoint)
-Average PPFD/watt of all 5 measurements (will be our corresponding Y datapoint)
-"Ratio of center to corners" - this is the ratio of the center measurement to the average of the 4 corner measurements, as you can see the center consistently reads right about 5% higher than the average of the four corners. this gives me a fuzzy feeling that the data is somewhat consistent and valid. (or at least not complete rubbish!)

upload_2017-6-11_3-53-13.png
 
Last edited:

CobKits

Well-Known Member
4up

upload_2017-6-11_4-4-14.png

little more droop at 3A for a few reasons:
only 4 cobs vs 8, so each cob is doing twice the duty
voltage is slightly higher than in the 8 cob test as expected- once again we see that old rule of thumb - "half the current and efficiency increases by 10%". dropping from 8 to 4 cobs our ppfd/W drops from 1.16 to 1.06, about 10%.

The fact that its "only" dropping 10% in efficiency and droop is (slightly increased but) still stable means were not exceeding out heatsink capacity, which is good

average measurements- note that our ratio of center to corners, while still consistent from test to test, has jumped from 5% to 7.5+%. this is somewhat expected as we have less cobs> less uniform coverage. I'm personally surprised the difference is so great at almost 6 feet away!

upload_2017-6-11_4-9-28.png
 
Last edited:

CobKits

Well-Known Member
sorry to leave y'all hangin. Im not a great blogger. i had a bunch more results i meant to post but didnt get to it. so I've described my method so ill just put out the data
 

CobKits

Well-Known Member
Heres the average data plotted. QBs were def a cut above the other board, the other board's low current data is suspicious, i'm working on testing another sample. sorry to be anonymous about that board i dont want to throw anyone under the bus when im not sure the board was a good one. If they want to comment about it they can.

Its been so freaking hot here ive been leery to do any test but will pick it up soon. COBs held their own, esp for cheap 1212s. 4 of them had the same output/efficiency to the QB288. So depending on your application there could be situations where the coverage of 4 separate luminares might be better. Considering the scalability of COBs, its probable that 3 cxm22s or 2 1825s would have similar performance, esp on heatsinks better optimized for the thermal requirements on the densely packed COBs

re: cobs the "10%" rule of thumb is in effect per usual - cut current of a chip in half, relative efficacy goes up 10%

also we can observe that like all phosphor-based leds ive tested, they converge at low currents

8 cob setup only has about a 7% advantage over 4-cob setup or QB288 at 30W, but has a 13-14% advantage at 150W. im sure a lot of this is thermal effect (theoretically all, but my point being there may be room for improvement if cooling better optimized for each setup)


upload_2017-6-23_19-15-27.png
 
Last edited:

Randomblame

Well-Known Member
Hope they do!
Seems the unnamed 561c board did not use real 561c diodes. Also if it's only a lower bin it should perform much better.
So maybe a fake?!
At the moment, many users want the strips and boards to be manufactured via alibaba, shenzen bright and other sellers for significantly cheaper and supposedly 561c top bin. Unfortunately there is no visible authenticity feature on these mid-power diodes and you are the first one who provide usable data on alternative boards. I've been waiting for that since the first fake boards/strips coming up to the show. Many thanks!!
 
Top