My Arduino & LEDs

ttystikk

Well-Known Member
By "normal" I meant the physics governing those particular devices.
Why don't I explain more? I'd like to capitalize on my ideas and knowledge for a change, instead of just giving them away so freely. It is nothing personal, I assure you.
If you want to keep it to yourself, then don't be dropping breadcrumbs and then shunning people with, 'I wanna keep it to myself'. That's asinine.
 

apoulin

Well-Known Member
Ok guys, got some updates!!!

So I got everything roughly working lol

I have the DHT11 working well, I have the DS18B20 recording just as accurately as the DHT11 (both just recording air temp as of now). I have the GFCI lighting receptacle wired up to the 5V relay.

I ended up buying a 2ft 3 prong extension cord from Home Depot for $2, I used the cord and it had a White (Neutral), Green (Ground) and Black (Hot) wire. I wired the white and green directly to the GFCI outlet, I then took the black wire and connected it to the COM(Common, Middle Post) on the relay and the NC(Normally closed, Left Post) to the Live side of the GFCI outlet. This allows me to send a signal to the digital pin 5 (Hight,Low) on my arduino and activate/deactivate the relay. The relay turns the outlet on and off, I connected a lamp to test it out and it worked as expected.

One thing about the 5v 4Channel Relay board is that it has a jumper to power form the arduino or from an external source. I am powering it with an old iPhone charger brick (5v @ 1A) with an old mini-USB cable harvested and using the 5V supply to give the relays their own power source instead of pulling that power from my arduino. I did this because I have sensors and other relays to control from my board.

I purchased all of the parts for this at Home Depot for less than $15

GFCI outlet ~$11
Plastic Outlet Box ~$.75
Three-Prong Cord ~$2
USB Brick ~$Free
MircoUSB Cord ~$Free

I was wanted to log data from the serial monitor since my arduino is hooked up via USB to my computer. There didn't seem to be any native support for this, so I ended up doing some searching and found a nice little program called CoolTerm and it allows me to record the serial monitor and save it to a file. I plan on logging this info and creating some nice graphs.

1.Light turned on
2.Everything wired up temporarily


:peace:bongsmilie
 

Attachments

Abiqua

Well-Known Member
Ok guys, got some updates!!!

So I got everything roughly working lol

I have the DHT11 working well, I have the DS18B20 recording just as accurately as the DHT11 (both just recording air temp as of now). I have the GFCI lighting receptacle wired up to the 5V relay.

I ended up buying a 2ft 3 prong extension cord from Home Depot for $2, I used the cord and it had a White (Neutral), Green (Ground) and Black (Hot) wire. I wired the white and green directly to the GFCI outlet, I then took the black wire and connected it to the COM(Common, Middle Post) on the relay and the NC(Normally closed, Left Post) to the Live side of the GFCI outlet. This allows me to send a signal to the digital pin 5 (Hight,Low) on my arduino and activate/deactivate the relay. The relay turns the outlet on and off, I connected a lamp to test it out and it worked as expected.

One thing about the 5v 4Channel Relay board is that it has a jumper to power form the arduino or from an external source. I am powering it with an old iPhone charger brick (5v @ 1A) with an old mini-USB cable harvested and using the 5V supply to give the relays their own power source instead of pulling that power from my arduino. I did this because I have sensors and other relays to control from my board.

I purchased all of the parts for this at Home Depot for less than $15

GFCI outlet ~$11
Plastic Outlet Box ~$.75
Three-Prong Cord ~$2
USB Brick ~$Free
MircoUSB Cord ~$Free

I was wanted to log data from the serial monitor since my arduino is hooked up via USB to my computer. There didn't seem to be any native support for this, so I ended up doing some searching and found a nice little program called CoolTerm and it allows me to record the serial monitor and save it to a file. I plan on logging this info and creating some nice graphs.

1.Light turned on
2.Everything wired up temporarily


:peace:bongsmilie

Hey, I guessed I missed it, what operating system are you running?

No native support, although Heckler again recommended I check out the "Processing" progam on Arduino....interesting program that I only have taken a quick look at....for future reference....
http://learning.codasign.com/index.php?title=Beginning_Processing_and_Arduino

Also:
gobetwino
hyperterminal
Labview [since your a student] http://rollitup.org/t/lets-make-a-lux-meter-bh1750-arduino-labview2013-erection.824186/page-2

You could also build a python script to output as well....http://forum.arduino.cc/index.php?topic=6464.0


I ask because have been running on Xp, W8 was ultra wonky, fucked up in fact....I got past most of the workarounds found online and still couldn't get the compiler to load...haven't tried since....
but on XP is the Hyperterminal program....but not available on W8. Hyperterminal will output a text file. I need to read up on how to interact with .cvs files....it works though....

Thanks on the coolterm tip, I missed that one....Please post up at least your experiences running coolterm.... one thing I noticed is that you cannot monitor your port, while running Coolterm.....I am going to download a copy tonight and mess around :peace:
 

apoulin

Well-Known Member
Hey, I guessed I missed it, what operating system are you running?

No native support, although Heckler again recommended I check out the "Processing" progam on Arduino....interesting program that I only have taken a quick look at....for future reference....
http://learning.codasign.com/index.php?title=Beginning_Processing_and_Arduino

Also:
gobetwino
hyperterminal
Labview [since your a student] http://rollitup.org/t/lets-make-a-lux-meter-bh1750-arduino-labview2013-erection.824186/page-2

You could also build a python script to output as well....http://forum.arduino.cc/index.php?topic=6464.0


I ask because have been running on Xp, W8 was ultra wonky, fucked up in fact....I got past most of the workarounds found online and still couldn't get the compiler to load...haven't tried since....
but on XP is the Hyperterminal program....but not available on W8. Hyperterminal will output a text file. I need to read up on how to interact with .cvs files....it works though....

Thanks on the coolterm tip, I missed that one....Please post up at least your experiences running coolterm.... one thing I noticed is that you cannot monitor your port, while running Coolterm.....I am going to download a copy tonight and mess around :peace:
I am using Windows 7, and haven't had any issues compiling or running anything. I left the serial monitor open and running while I went to work, I also started CoolTerm. The program displayed exactly what the serial output displayed but with the options to save the data. It was pretty easy to set up and use for me, I don't even think I had to select a port to monitor. There is an option to save directly to a text file, that automatically saves the data in a folder with a date stamp.

Thank you for the rest of the software suggestions, I will be investigating them to make sure I have the best one for my application!

So far it looks like everything is working as planned:
Sensors recording accurately, Relays activates/deactivates on command and now I have an easy-to-use program for logging serial data.

My next step is to create a voltage divider to be able to measure the high DC voltage from my LEDs, I have been thinking of monitoring the voltage of the entire string (At the driver/LED string connection, high voltage!) OR measure each LED individually (Working with much lower voltages, able to detect issues in each individual LED).

I will be playing around with everything some more today, so I will have some updates in a bit.

:peace:bongsmilie
 

apoulin

Well-Known Member
Had a nice post written and it threw me an error when I tried to upload some pics because I wasn't logged in, totally deleted my post :finger:

So lets try this again.....


I have some updates!!

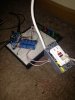
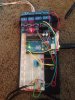
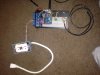
I got the arduino secured to a breadboard with some extra wire and breadboard holes lol I have the relay module zip tied to the end of the breadboard so I can have everything on a letter size breadboard, including the sensor wiring. I do not have much tension on any of the wires so that is why I chose this.....flexible....design lol

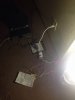
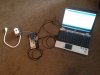
I placed the DHT11 and breadboard under my ladies legs and placed the DS18B20 in the res. I connected a CFL lamp to the relay and fired everything up. I had CoolTerm logging the serial data to a text file on my desktop. I was then easily able to create an Excel spreadsheet and graph from it. I am sure there is an easier way to import and do this in a more automated manner, but for testing purposes it works!

I set the logger up to log every minute just to get some data points gathered to test the process out, let it run for about 20 mins and did some medicating:bigjoint: I then graphed the data out and was going to post them lol My environment however did not change very much and the graphs were relatively straight lines..soooo you get the idea.

I have yet to fully integrate it into my grow area since I am still tinkering. I have not tried to power my LEDs on, but I do not anticipate any problems because it worked fine with a CFL lamp.


Here is what the text file CoolTerm created looks like

2015-04-25 14:26:31 Humidity_(%): 39.0000000000
2015-04-25 14:26:31 Temperature_(F): 75.1999969482
2015-04-25 14:26:34 Temp_Resevoir_(F): 71.82

2015-04-25 14:26:34 Read sensor: OK
2015-04-25 14:26:34 Humidity_(%): 38.0000000000
2015-04-25 14:26:34 Temperature_(F): 75.1999969482
2015-04-25 14:26:37 Temp_Resevoir_(F): 71.82

2015-04-25 14:26:37 Read sensor: OK
2015-04-25 14:26:37 Humidity_(%): 38.0000000000
2015-04-25 14:26:37 Temperature_(F): 75.1999969482
2015-04-25 14:26:40 Temp_Resevoir_(F): 71.82

2015-04-25 14:26:40 Read sensor: OK
2015-04-25 14:26:40 Humidity_(%): 38.0000000000
2015-04-25 14:26:40 Temperature_(F): 75.1999969482
2015-04-25 14:26:42 Temp_Resevoir_(F): 71.82

2015-04-25 14:26:42 Read sensor: OK
2015-04-25 14:26:43 Humidity_(%): 38.0000000000
2015-04-25 14:26:43 Temperature_(F): 75.1999969482
2015-04-25 14:26:45 Temp_Resevoir_(F): 71.82

2015-04-25 14:26:45 Read sensor: OK
2015-04-25 14:26:45 Humidity_(%): 38.0000000000
2015-04-25 14:26:45 Temperature_(F): 75.1999969482
2015-04-25 14:26:48 Temp_Resevoir_(F): 71.82


:peace:bongsmilie
 

Attachments

apoulin

Well-Known Member
So I ordered some parts today:

Addicore nRF24L01 + 2.4GHz Wireless Transceiver - $6.85
Female/Male, Female/Female wires 80ct -$6.59
SunFounder Uno R3 Acrylic Case - $12.99
40x Jewelers Loupe - $5.58

Total: $32.01

My thoughts are to use the case to have a solid safe mounting option for the Arduino. Use the WiFi transceiver to send the data wirelessly to my desktop computer. I wanted to buy these wires to make wiring to my headers easy, especially with this case on. I bought the loupe because I am a few weeks from harvest, time to start checking trichs!


I have it up and running, however it is not in the grow area until I get the Arduino in a case and get the wireless working properly. I do not want to have my laptop and Arduino in the same closet as my DWC tote right now, the heat and humidity climbed with the added electronics running and monitoring. Once I have the Arduino and sensors properly mounted, I will have it sending everything to my desktop computer wirelessly so I won't have the added heat/humidity issues in my closet.

I have been thinking about the Excel graphing ideas and have been thinking of just creating a Desktop server to manage my Arduino's programming and data logging. I can then use that Desktop, which is connected to my wireless home network. This will allow me to log into the IP on my home network from my web browser on my smartphone/tablet/laptop (connected via WiFi) and have a nice user interface for displaying the graphs.

*IF* I wanted to at that point I could allow it access to the internet, which would allow me to log in and view it remotely. Considering the activity, this will not be happening:leaf:

:peace:bongsmilie
 

Abiqua

Well-Known Member
I was able to go thru coolterm last night as well as hyperterminal using a soil moisture probe, then graphed my results in excel...check it out if you are interested
http://rollitup.org/t/small-spaces-led-organics.849178/page-6#post-11542016


On "processing" a note: this is an entire OS basically, the "visual" equivalent of Arduino's ide....As of right now, the limitation I see from Coolterm and other simple emulators/terminals, well frankly my skills don't allow the "real-time" work-around.....but using it to graph data from a txt file or an SD card is great, easy, No hassles...

But "processing" allows you to grab it in realtime and even graph it in realtime, in addition to just storing it into a .txt file as well...the code is floating around up there in the links....I urge you to check out "processing" especially for the wifi portion...

that is where I am at tonight...Keep up the good work on your project :peace:
 

alesh

Well-Known Member
I was able to go thru coolterm last night as well as hyperterminal using a soil moisture probe, then graphed my results in excel...check it out if you are interested
http://rollitup.org/t/small-spaces-led-organics.849178/page-6#post-11542016


On "processing" a note: this is an entire OS basically, the "visual" equivalent of Arduino's ide....As of right now, the limitation I see from Coolterm and other simple emulators/terminals, well frankly my skills don't allow the "real-time" work-around.....but using it to graph data from a txt file or an SD card is great, easy, No hassles...

But "processing" allows you to grab it in realtime and even graph it in realtime, in addition to just storing it into a .txt file as well...the code is floating around up there in the links....I urge you to check out "processing" especially for the wifi portion...

that is where I am at tonight...Keep up the good work on your project :peace:
Or you can use ethernet shield, Google Charts API and have Arduino print charts into your browser over LAN. Totally standalone. There's so many various API's that you can do a powerful design with Arduino and Ethernet shield.
 

Abiqua

Well-Known Member
Or you can use ethernet shield, Google Charts API and have Arduino print charts into your browser over LAN. Totally standalone. There's so many various API's that you can do a powerful design with Arduino and Ethernet shield.
I will mark that down and read up....there are many and I there are more I haven't even listed...
gobetwino and .Net between two other similar possibilities?

.and in all honesty I am interested really in just using a Python script and grabbing the txt data as it comes over the ether...and doing the same thing you describe, which may be in fact what you are describing...[I am not familiar with their API]

"processing" is nice imo because of the Arduino-like structure
 

alesh

Well-Known Member
I will mark that down and read up....there are many and I there are more I haven't even listed...
gobetwino and .Net between two other similar possibilities?

.and in all honesty I am interested really in just using a Python script and grabbing the txt data as it comes over the ether...and doing the same thing you describe, which may be in fact what you are describing...[I am not familiar with their API]

"processing" is nice imo because of the Arduino-like structure
Processing is nice ofc. This is kinda different approach -- computer is not required at all.
 

Abiqua

Well-Known Member
Processing is nice ofc. This is kinda different approach -- computer is not required at all.
When you get a chance Alesh, could you elaborate...I think this would be great info for the thread...I have a slight handle on what is needed for communication, but only vaguely aware of what each [that I have read up on] different program actually offers or what platforms software wise they use for communication....

Could you expound on any of that :) I get a feel you and church too, have a real good feel for micro electronics or at least how they function :peace:
 

alesh

Well-Known Member
When you get a chance Alesh, could you elaborate...I think this would be great info for the thread...I have a slight handle on what is needed for communication, but only vaguely aware of what each [that I have read up on] different program actually offers or what platforms software wise they use for communication....

Could you expound on any of that :) I get a feel you and church too, have a real good feel for micro electronics or at least how they function :peace:
Basic concept is that Arduino is running whatever you want it to run and storing data on the SD card AND also running a simple webserver. When you try to connect to Arduino's IP, the request is handled by the webserver, you're served a page from the SD card with the data and link to whichever API you like. Your browser downloads the API and all the data processing and fancy, computing-difficult stuff is done in your browser. A downside is that you've to be connected to the internet in order to load API(s).
 

apoulin

Well-Known Member
Anyone know anything about Plotly. It says it is a real-time graphing program that is for the arduino, there is a tutorial for using a DHT22 Sensor w/arduino. All of the sketches are written, it is well documented. There were a lot of remote sensor examples and the graphs had no indication of what they were monitoring, so maybe security wouldn't be an issue as long as there aren't any video/picture feeds:leaf:

I can't wait for my parts to get here so I can get it all set up and logging, that is the first step lol At that point choosing a way to easily graph them should be pretty easy considering all of the suggestions on here.

I know the EC sensor and PH sensor are pricey >$100 each. What are your thoughts on this? Which would you buy first and why?

:peace:bongsmilie
 

Abiqua

Well-Known Member
Anyone know anything about Plotly. It says it is a real-time graphing program that is for the arduino, there is a tutorial for using a DHT22 Sensor w/arduino. All of the sketches are written, it is well documented. There were a lot of remote sensor examples and the graphs had no indication of what they were monitoring, so maybe security wouldn't be an issue as long as there aren't any video/picture feeds:leaf:
There's a few vids of people using plot.ly for a few projects and there is an aquaponic site that uses plot.ly in their api and you just click and choose your sensors even...don't even have to code your arduino manually...I will try and dig that out....

One thing I would worry about, is your uploading Everything [at least the parameters you set] and then pulling down what you want to see...tough to keep security...Personally I would rather throw to a LAN computer aka server and then have that send out what parameters I want at that particular time and not access to the whole dataset...at least this way you could connect in thru a VPN even with android......you might even be able to port Coolterm in realtime thru a VPN, as a saw a download version of CT for android.....

I guess I am stuck on that avenue, because I don't store things online, but do want to stay connected...tonight I am reading thru the Gobetwino manual and then going to down load processing to work with it in a similar manner..

http://www.mikmo.dk/gobetwino.html
https://processing.org/

Googlecharts can do the same thing as plot.ly maybe even more refined for certain aspects, but again, being that its "cloud" storage, it will have its pros and cons....


I can't wait for my parts to get here so I can get it all set up and logging, that is the first step lol At that point choosing a way to easily graph them should be pretty easy considering all of the suggestions on here.

I know the EC sensor and PH sensor are pricey >$100 each. What are your thoughts on this? Which would you buy first and why?

:peace:bongsmilie
Links? Curious about the probe manufacturer :joint:
 

Bigger Bud

Member
+1 on using an ethernet shield. I have a custom watering system using an Arduino MEGA with the shield -- i control it and receive data with simple JSON commands from a different machine. Keeps the arduiono loop nice and tight and simple and other computer does all the heavy lifting.
 
Top