I'd like someone to accurately tell me why

Fadedawg

Well-Known Member
Well one can't assume that. cbn is but one byproduct and formed mainly at higher temps and with oxidation relatively slowly from my experience but the isomers are far more likely to appear and account for discoloration and change in stability....they can get oily
No measurements, but to maybe put it in perspective, Jumps decarboxylation curve shows us that when oil is heated, and is about 70% decarboxylated, that the rate that THC is converted to CBN, is faster than the remaining 30% THCA is converted to THC.

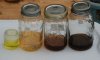
Our own chromatography experiments show that the most darkly colored elements in cannabis oil, aren't cannabinoids and were retained by the column based on their higher polarity. That suggests that while CBN may be darker in color, it isn't responsible for all the darker colors.

Joe thinks some of the darkness maybe from plant sugars caramelizing with heat, but we've haven't sent off any samples for MS analysis.

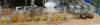
The first jar in the picture is almost devoid of cannabinoids, because the oil was in carboxylic acid form, and the last three are almost devoid of cannabinoids, containing the higher polarity fractions. The other picture shows the extreme and center fractions. The center (3) fraction contained the highest levels of cannabinoids of the total fractions. It also gives some indication of color.
 

Attachments

god1

Well-Known Member
No measurements, but to maybe put it in perspective, Jumps decarboxylation curve shows us that when oil is heated, and is about 70% decarboxylated, that the rate that THC is converted to CBN, is faster than the remaining 30% THCA is converted to THC.
FD, I'm curious how you came to that conclusion based on Jump's graph?

I believe that graph is based on a study on decarboxylation of cannabinoid acids published back in 1990.

That work was specifically trying to determine if open reactors were appropriate for this application. The conclusion was that it wasn't and the graph was a key part of that paper.
 

god1

Well-Known Member
FD, I'm curious how you came to that conclusion based on Jump's graph?

I believe that graph is based on a study on decarboxylation of cannabinoid acids published back in 1990.

That work was specifically trying to determine if open reactors were appropriate for this application. The conclusion was that it wasn't and the graph was a key part of that paper.

I might add, that the first time I saw that graph it never made any sense to me --- so I had to look up the paper.
 

MiG pilot

Well-Known Member
The other picture shows the extreme and center fractions. The center (3) fraction contained the highest levels of cannabinoids of the total fractions. It also gives some indication of color.
Hey Fadedawg!, please specify the contents of number 1, light yellow liquid, what is it?
 

Fadedawg

Well-Known Member
FD, I'm curious how you came to that conclusion based on Jump's graph?

I believe that graph is based on a study on decarboxylation of cannabinoid acids published back in 1990.

That work was specifically trying to determine if open reactors were appropriate for this application. The conclusion was that it wasn't and the graph was a key part of that paper.
I came to that conclusion looking at the total THC rise and then drop off sharply. Where did it go as the heating continued?
 

god1

Well-Known Member
I came to that conclusion looking at the total THC rise and then drop off sharply. Where did it go as the heating continued?
I always find it wise to consider the source and application when evaluating empirical data. Without correlating the graph to the study it's easy to take the data out of context. The experiment started to go "wonky" at 122 deg C.

Here's a direct quote from the paper re the graph:

"Quantitative results obtained for d9-tch are shown in fig 3. The results indicate that below 122 deg C the amount of thc increased even after heating for 50 min. This illustrates the low velocity of the decarboxylation, Similar results were obtained for CBD. The decrease in the amount of cannabinoids observed at 122 and 145 deg C is caused by the evaporation, which was confirmed by TLC analysis of the evolved gases. Owing to the simultaneous evaporation during the carboxylation, the total cannabinoid content could not be directly measured."

Also note, that there was no published analysis as to the actual composition of the decarbed product. In fact, they never really give a good description of the starting material.

In the paper there is a discussion re using various sorbent surfaces in an attempt to minimize evaporation effects on the neutral cannabinoids.

A more interesting graph that was presented was based on a sample studied as a function of time at 145 deg C. According to the paper, the starting sample contained d9-thc, cbn, no cbd and no isomer -- d8. (interesting description of the starting material, to say the least).

The resulting graph, showed a substantial decrease in d9, an appearance of d8, (which increased substantially), and slight decrease in cbn. At 9 minutes out, the d8-thch had exceeded the starting mag of both d9-thc and cbn.

Note, there is no data beyond 9 mins..

Coming from an eng/instrumentation back ground, my impression is that somebody just got a new "shinny" toy in the lab and was told to publish something. This paper reminds me of "hall-way - cubby" discussions --- prior to publishing.

As always, wishing the best.
 
Top