wietefras
Well-Known Member
Besides growing cannabis, one of my other hobbies is Arduino. This is a cheap and easy to use microcontroller board which can be used to automate all kinds of things.
https://www.arduino.cc/
I’m constantly thinking of new things I can do with the Arduino and perhaps my experiments can be a source of inspiration for others who have the same hobbies")
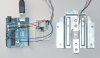
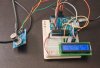
I started out with an Arduino Mega 2560 R3 clone and real time clock module to create a data logger. This is what the sensors get connected too. The data from these sensors is then stored in a database which resides on a Raspberry pi microcomputer. I created a web interface which also runs on the Raspberry pi to produce charts with the sensor data.
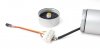
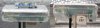
Initially I had the Arduino built in to a little card board box:
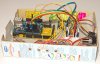
Very high-tech obviously I have since moved the Arduino to a plastic housing, but the wiring is still similar. At some point I want to make a printed circuit board where I can put everything in a more permanent position.
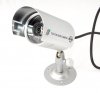
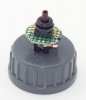
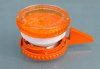
In the grow tent I have a sensor box which contains:
- On top a lux sensor (BH1750FVI)
- On the bottom a temperature/RH sensor (DHT22/AM2302)
- 15cm below a separate temperature (DS18B20 waterproof)
- Another waterproof temperature sensor is used to measure soil or water temperature (hydro)
- Another temperature/RH sensor is located in the intake to measure temperature and humidity of the air that enters the tent.
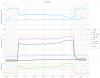
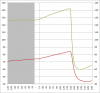
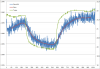
The data from all these sensors gets combined into charts like this:

I keep coming up with new sensors that I can hook up to the Arduino. For instance:
- Plant temperature sensor
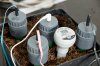
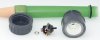
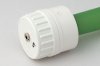
- Tensiometers (soil humidity)
- CO2 sensor
- pH, EC, DO
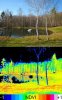
- IR Thermal imaging
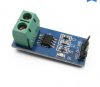
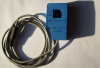
- Power usage (current sensor)
I also started to use Arduino’s to control some aspects of the grow
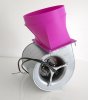
- 0-10V fan controller
- Reservoir top off
- Nutrient mixing
I will add more posts describing the various things I tried and will try in the future.
https://www.arduino.cc/
I’m constantly thinking of new things I can do with the Arduino and perhaps my experiments can be a source of inspiration for others who have the same hobbies
I started out with an Arduino Mega 2560 R3 clone and real time clock module to create a data logger. This is what the sensors get connected too. The data from these sensors is then stored in a database which resides on a Raspberry pi microcomputer. I created a web interface which also runs on the Raspberry pi to produce charts with the sensor data.
Initially I had the Arduino built in to a little card board box:
Very high-tech obviously
In the grow tent I have a sensor box which contains:
- On top a lux sensor (BH1750FVI)
- On the bottom a temperature/RH sensor (DHT22/AM2302)
- 15cm below a separate temperature (DS18B20 waterproof)
- Another waterproof temperature sensor is used to measure soil or water temperature (hydro)
- Another temperature/RH sensor is located in the intake to measure temperature and humidity of the air that enters the tent.
The data from all these sensors gets combined into charts like this:
I keep coming up with new sensors that I can hook up to the Arduino. For instance:
- Plant temperature sensor
- Tensiometers (soil humidity)
- CO2 sensor
- pH, EC, DO
- IR Thermal imaging
- Power usage (current sensor)
I also started to use Arduino’s to control some aspects of the grow
- 0-10V fan controller
- Reservoir top off
- Nutrient mixing
I will add more posts describing the various things I tried and will try in the future.
Last edited: