Normalized to what? What are "quantum" values? Why don't these charts have units and values on the y-axis?
All this uncertainty really renders these charts meaningless to us. It's not "scientific" at all.
"Uncertainty" as it applies to you. Your uncertainty is unfounded.
My spectrometer is dual calibrated to NIST LED standards for NIST traceable calibrated measurements from 200 to 850 nm. See attached SpectroRadiometerCalibrations.pdf
I use the CR-2 cosine detector.
On top of that comes his incredibly sloppy math.
There is not much math, (just the scaling) involved to warrant "incredibly sloppy math" which does not exist in these charts.
Normalization refers to the creation of scaled values, where the intention is that these normalized values allow the comparison of corresponding normalized values for different datasets in a way that eliminates the effects of certain influences.
In my graphs are all normalized to the CLU028-1204C4-303M2K1where it is scaled as explained in a previous post with all the math.
Where is the incredibly sloppy math???
I convert the $spectra from text to decimal $values.
$max = max($values);
$scale = 280/$max;
$normalize = 1/$max;
for each wavelength I get the x and y values to be plotted
$y = round(300 - ($scale * $values[$wavelength] ));}
$x = ($wavelength - 380) * 2;
Then add the vertical line for that wavelength to the SVG image.
echo '<line x1="' . $x . '" y1="300" x2="' . $x . '" y2="' . $y . '" stroke="#' . $hex[$wavelength] . '" opacity="1"/>' . "\n";
Here is where the scale was set for the chart which is 280 pixel in height: $scale = 280/$max;
In this case the scale is 81x and this scale was used for all the charts in these posts.
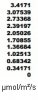
This scale is based on the CLU028-1204C4-303M2K1 peak value of 3.4076E+000 @ 614nm which if added to the chart would be meaning less. If you really wanted to know this value you could have looked it up in the measured data attached to the post in document:
What are "quantum" values?
Quantum: see attaced ConversionLux.pdf
The term quantum comes from the Latin ‘quantus’ for ‘how much’ as in amount or quantity. A quantum is considered to be ‘a discrete packet’ with energy stored in them. For example, a photon is a single quantum of light.
From Merrium-Webster: any of the small subdivisions of a quantized physical magnitude.
In LED lighting Radiometric values refer to the energy in the photons measured in watts. Photometric and Luminous are the radiometric values adjusted to the sensitivity of the human eye. And Quantum is the quantity of photons independent of the amount of energy carried by each photon.
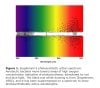
Why don't these charts have units and values on the y-axis?
The purpose of normalized charts is to remove superfluous information that tends to distract.
the graphs are simply a scaled values for a visualized comparison and units would only be a distraction. Although I did mention the values before they were scaled and I did included the files with all the data used. I did not feel the units were necessary for a visual comparison. I fail to see how these numbers on the horizontals would be of any value for the purpose here, but if you want you can add them yourself. Knock yourself out.
Thing is, you describe some calculation which should show "normalizing" but other than calculating some "normalize" constant it doesn't actually do that. The charts don't look "normalized" either, but they seem to show absolute PPFD values per nm. If so, then watts and distance would matter.
The reason they appear to show absolute PPFD values is becasue they are scaled from absolute PPFD values as stated in my post:
3000K 80 CRI 484/477 µmol/m²/s
2700K 97CRI 430/414 µmol/m²/s
What matters is not the distance or watts, only that the distance and current were the same. The distance is shown in the photo.
watts/m² also are irrelevant see ConversionLux.pdf
Distance and watts only matter for the graph titled "3000K 80 CRI minus 2700K 97CRI" comparison to be accurate when the difference was graphed. That is why I stated this:
Each CoB was measured at the same distance from the detector and driven with the exact same Mean Well HDD-H driver with a fixed current.
In normalized charts the actual values do not matter. It is a comparison. It only matters that the SAME distance and current were used. I use the exact same LDD-700H driver.
For purposes of comparing the spectra of the two LEDs to to CRI (first post) distance and wattage would not matter at all (even if they were different) and both LEDs could have been normalized to their own max values as is done in SPD charts in the datasheets.
Whatever he's measuring can be derived from the datasheets anyway
The data I measured cannot be derived from the datasheets unless quantum flux intensity is given. You can estimate the radiometric Flux Density with the SPD chart. You cannot derive mol/m²/s (flux intensity) from lux or W/m² or mol/m².
If the datasheet includes Intensity (W/sr lm/sr) you could make an approximation of of radiance W/m²/sr or luminance (lm/m²/sr) becasue they both have steradian in the denominator. .
If you were to read (and understand) my post you would know exactly what was measured and exactly what is displayed on the graphs.
Rahz already did that at the beginning of this thread
I did not see the color graphical representations of the PPFD and the difference between two CoBs.
I do not believe there was any spectral comparison of each wavelength to show the influence of the particular wavelengths as they are related to CRI.
Alesh posted some charts showing absolute power per wavelength too.
Alesh does not have PPFD values. His values are estimated PPF. My values are actual measured PPFD with an instrument where the calibration is traceable to NIST standards using a cosine detector.
RECAP
The only math needed was to scale the measured values to fit on a chart with a height of 280 pixels. All numbers were multiplied by 81.
Distance and watts did not matter, only that they were the same for both sets of measurements.
The measured values cannot be calculated from the datasheet as there is no conversion between measurement geometries, for example, W/² and µmol/m²/s or PPF (µmol/m²) and PPFD